Figure 3
Only low intensity of aerobic exercise improves respiratory compliance in pulmonary hypertensive rats
Katya Rigatto*, Denielli Da SG Bós, Renata Fernandes, Rodrigo B Jaenisch and Pedro Dal Lago
Published: 20 November, 2019 | Volume 4 - Issue 3 | Pages: 205-209

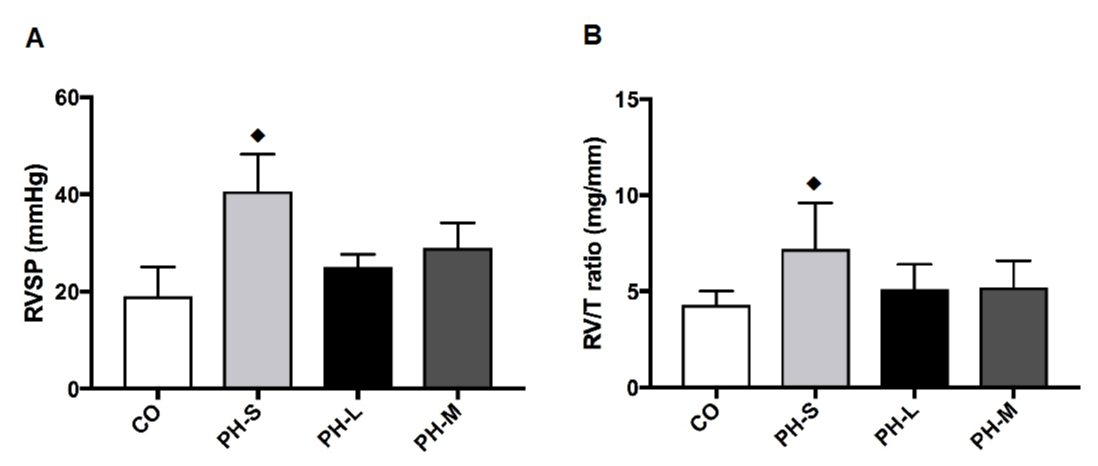
Figure 3:
Panel A: RVSP: Results of the right Ventricle Systolic Pressure; Panel B: RV: The ratio between Right Ventricle; weight in mg and the tibia (T) length in mm. CO: Control Group (n = 4); PH-S: Sedentary Group (n = 4); PH-L: Low Intensity Training (n = 5); PH-M: Moderate Intensity Training (n = 5). Values expressed as mean ± standard deviation; Data were compared by one-way ANOVA followed by Student-Neuman-Keuls test ♦(p < 0.05); vs all groups.
Read Full Article HTML DOI: 10.29328/journal.jccm.1001069 Cite this Article Read Full Article PDF
More Images
Similar Articles
-
Are S-Klotho’s Maximal concentrations dependent on Exercise Intensity and Time in young adult males?Moran Sciamama Saghiv*,David Ben-Sira,Ehud Goldhammer,Michael Sagiv. Are S-Klotho’s Maximal concentrations dependent on Exercise Intensity and Time in young adult males?. . 2019 doi: 10.29328/journal.jccm.1001033; 4: 006-011
-
Anomalies of coronary artery origin: About two casesDioum M*,Sarr EM,Manga S,Mingou JS,Diack A,Diop AD,Bindia D,Diagne PA,Sarr AN,Diop IB. Anomalies of coronary artery origin: About two cases. . 2019 doi: 10.29328/journal.jccm.1001051; 4: 117-119
-
Only low intensity of aerobic exercise improves respiratory compliance in pulmonary hypertensive ratsKatya Rigatto*,Denielli Da SG Bós,Renata Fernandes,Rodrigo B Jaenisch,Pedro Dal Lago. Only low intensity of aerobic exercise improves respiratory compliance in pulmonary hypertensive rats. . 2019 doi: 10.29328/journal.jccm.1001069; 4: 205-209
-
A Wolff-Parkinson-White (WPW) Electrocardiographic Pattern in Asymptomatic Patient – State-of-the-Art-ReviewVijay Yadav*,Sanjeev Thapa,Ratna Mani Gajurel,Chandra Mani Poudel,Bhawani Manandhar,Manju Sharma,Suman Adhikari,Suraj Shrestha. A Wolff-Parkinson-White (WPW) Electrocardiographic Pattern in Asymptomatic Patient – State-of-the-Art-Review. . 2022 doi: 10.29328/journal.jccm.1001132; 7: 046-053
-
Atrial fibrillation in elite athletes. What is missing?E Tsougos,E Giallafos, Paraskevaidis. Atrial fibrillation in elite athletes. What is missing?. . 2022 doi: 10.29328/journal.jccm.1001139; 7: 085-092
-
Chronic Ethanol Decreases the Left Ventricular Cardiac PerformanceCamargo VMB*, Damatto FC, Fioravante VC, Godoi AR, Stoppa EG, Okoshi MP, Okoshi K, Miranda JRA, Martinez FE. Chronic Ethanol Decreases the Left Ventricular Cardiac Performance. . 2024 doi: 10.29328/journal.jccm.1001181; 9: 067-072
-
Poor Diet Leading to the Increasing Risk of Atherosclerosis in the WorldBijaya Bhusal*. Poor Diet Leading to the Increasing Risk of Atherosclerosis in the World. . 2024 doi: 10.29328/journal.jccm.1001195; 9: 142-147
Recently Viewed
-
Coronaviruses have reached at Pre-elimination Stage with Nine Amino Acid Spike Deletions and Forty-nine Nucleotide 3’-UTR DeletionsAsit Kumar Chakraborty*. Coronaviruses have reached at Pre-elimination Stage with Nine Amino Acid Spike Deletions and Forty-nine Nucleotide 3’-UTR Deletions. Int J Clin Virol. 2024: doi: 10.29328/journal.ijcv.1001060; 8: 031-044
-
Hypercalcemia due to Elevated 1,25 dihydroxyvitamin D in Tophaceous Gout - Case Report and Literature ReviewMadhia Ahmad*,Sunnie Lee,Htay Htay Kyi,Shuwei Wang,Smitha Mahendrakar,Michael Yudd. Hypercalcemia due to Elevated 1,25 dihydroxyvitamin D in Tophaceous Gout - Case Report and Literature Review. J Clini Nephrol. 2024: doi: 10.29328/journal.jcn.1001143; 8: 142-145
-
Pseudocalcinosis Tumorale (Teutschlander Disease) in Chronic Hemodialysis PatientsOmaima Taie*, Najlaa Taie, Yassine Eddich, Hassan Chtata. Pseudocalcinosis Tumorale (Teutschlander Disease) in Chronic Hemodialysis Patients. J Clini Nephrol. 2024: doi: 10.29328/journal.jcn.1001142; 8: 138-141
-
Serum Levels of the C-terminal Fragment of Fibroblast Growth Factor 23 (C-FGF23) and Hepcidin in Patients with Hemodialysis Undergoing Treatment with a Proline Hydroxylase Domain (PHD) InhibitorYoshihiro Motomiya*, Yoshiteru Kaneko, Yasuki Motomiya, Yuichiro Higashimoto*. Serum Levels of the C-terminal Fragment of Fibroblast Growth Factor 23 (C-FGF23) and Hepcidin in Patients with Hemodialysis Undergoing Treatment with a Proline Hydroxylase Domain (PHD) Inhibitor. J Clini Nephrol. 2024: doi: 10.29328/journal.jcn.1001141; 8: 132-137
-
Anatomo-clinical and Etiological Profile of Nephropathies Biopsied in the Nephrology Department of the Thies Regional Hospital (Senegal)Ameth Dieng*, Modou Ndongo, Rokhaya Fall, Mame Selly Diawara, Mouhamadou Moustapha Cissé. Anatomo-clinical and Etiological Profile of Nephropathies Biopsied in the Nephrology Department of the Thies Regional Hospital (Senegal). J Clini Nephrol. 2024: doi: 10.29328/journal.jcn.1001140; 8: 127-131
Most Viewed
-
Evaluation of Biostimulants Based on Recovered Protein Hydrolysates from Animal By-products as Plant Growth EnhancersH Pérez-Aguilar*, M Lacruz-Asaro, F Arán-Ais. Evaluation of Biostimulants Based on Recovered Protein Hydrolysates from Animal By-products as Plant Growth Enhancers. J Plant Sci Phytopathol. 2023 doi: 10.29328/journal.jpsp.1001104; 7: 042-047
-
Sinonasal Myxoma Extending into the Orbit in a 4-Year Old: A Case PresentationJulian A Purrinos*, Ramzi Younis. Sinonasal Myxoma Extending into the Orbit in a 4-Year Old: A Case Presentation. Arch Case Rep. 2024 doi: 10.29328/journal.acr.1001099; 8: 075-077
-
Feasibility study of magnetic sensing for detecting single-neuron action potentialsDenis Tonini,Kai Wu,Renata Saha,Jian-Ping Wang*. Feasibility study of magnetic sensing for detecting single-neuron action potentials. Ann Biomed Sci Eng. 2022 doi: 10.29328/journal.abse.1001018; 6: 019-029
-
Pediatric Dysgerminoma: Unveiling a Rare Ovarian TumorFaten Limaiem*, Khalil Saffar, Ahmed Halouani. Pediatric Dysgerminoma: Unveiling a Rare Ovarian Tumor. Arch Case Rep. 2024 doi: 10.29328/journal.acr.1001087; 8: 010-013
-
Physical activity can change the physiological and psychological circumstances during COVID-19 pandemic: A narrative reviewKhashayar Maroufi*. Physical activity can change the physiological and psychological circumstances during COVID-19 pandemic: A narrative review. J Sports Med Ther. 2021 doi: 10.29328/journal.jsmt.1001051; 6: 001-007

HSPI: We're glad you're here. Please click "create a new Query" if you are a new visitor to our website and need further information from us.
If you are already a member of our network and need to keep track of any developments regarding a question you have already submitted, click "take me to my Query."


