Figure 1
Role of novel cardiac biomarkers for the diagnosis, risk stratification, and prognostication among patients with heart failure
Jennifer Miao, Joel Estis, Yan Ru Su, John A Todd and Daniel J Lenihan*
Published: 22 August, 2019 | Volume 4 - Issue 2 | Pages: 103-109
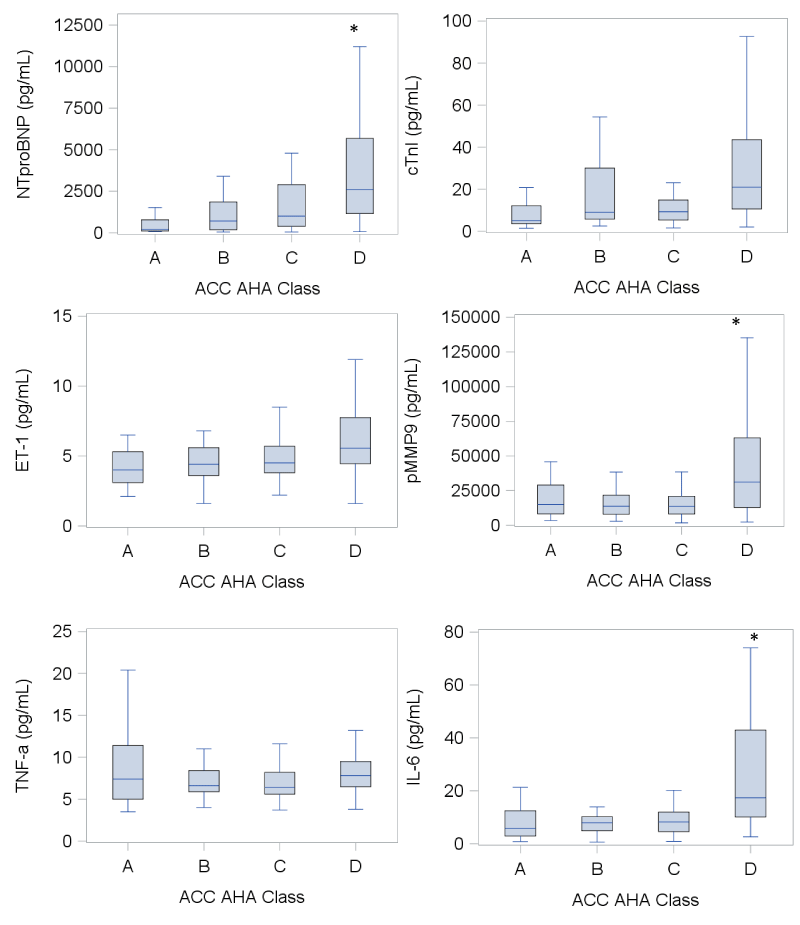 Plasma biomarker measurements across all ACC/AHA HF stages. Box-and whisker plots of plasma biomarker concentrations with box plot boundaries representing 25th and 75th percentile, horizontal line denoting the median, whisker extending to 1.5x interquartile range; Statistical significance determined by Bonferroni post-hoc analyses to compare concentrations across HF groups; *p<0.05, denoting significant differences in plasma biomarker concentrations in stage D HF compared to stages A, B, and C for NTproBNP, pMMP-9, and IL-6; ACC/AHA, American College of Cardiology/American Heart Association; NTproBNP, N-terminal pro-Brain Natriuretic Peptide; cTnI, high sensitivity Troponin I; ET-1, Endothelin-1; pMMP-9, plasma Matrix Metalloproteinase-9; TNFα, Tumor Necrosis Factor-alpha; IL-6, Interleukin-6." alt="jccm-aid1049-g001"class="img-responsive img-rounded " style="cursor:pointer">
Figure 1:
Plasma biomarker measurements across all ACC/AHA HF stages. Box-and whisker plots of plasma biomarker concentrations with box plot boundaries representing 25th and 75th percentile, horizontal line denoting the median, whisker extending to 1.5x interquartile range; Statistical significance determined by Bonferroni post-hoc analyses to compare concentrations across HF groups; *p<0.05, denoting significant differences in plasma biomarker concentrations in stage D HF compared to stages A, B, and C for NTproBNP, pMMP-9, and IL-6; ACC/AHA, American College of Cardiology/American Heart Association; NTproBNP, N-terminal pro-Brain Natriuretic Peptide; cTnI, high sensitivity Troponin I; ET-1, Endothelin-1; pMMP-9, plasma Matrix Metalloproteinase-9; TNFα, Tumor Necrosis Factor-alpha; IL-6, Interleukin-6.
Read Full Article HTML DOI: 10.29328/journal.jccm.1001049 Cite this Article Read Full Article PDF
More Images
Similar Articles
-
Left Atrial Remodeling is Associated with Left Ventricular Remodeling in Patients with Reperfused Acute Myocardial InfarctionChristodoulos E. Papadopoulos*,Dimitrios G. Zioutas,Panagiotis Charalambidis,Aristi Boulbou,Konstantinos Triantafyllou,Konstantinos Baltoumas,Haralambos I. Karvounis,Vassilios Vassilikos. Left Atrial Remodeling is Associated with Left Ventricular Remodeling in Patients with Reperfused Acute Myocardial Infarction. . 2016 doi: 10.29328/journal.jccm.1001001; 1: 001-008
-
Mid-Ventricular Ballooning in Atherosclerotic and Non-Atherosclerotic Abnormalities of the Left Anterior Descending Coronary ArteryStefan Peters*. Mid-Ventricular Ballooning in Atherosclerotic and Non-Atherosclerotic Abnormalities of the Left Anterior Descending Coronary Artery. . 2016 doi: 10.29328/journal.jccm.1001002; 1:
-
Concentration Polarization of Ox-LDL and Its Effect on Cell Proliferation and Apoptosis in Human Endothelial CellsShijie Liu*,Jawahar L Mehta,Yubo Fan,Xiaoyan Deng,Zufeng Ding*. Concentration Polarization of Ox-LDL and Its Effect on Cell Proliferation and Apoptosis in Human Endothelial Cells. . 2016 doi: 10.29328/journal.jccm.1001003; 1:
-
Intermittent Left Bundle Branch Block: What is the Mechanism?Hussam Ali*,Riccardo Cappato. Intermittent Left Bundle Branch Block: What is the Mechanism?. . 2017 doi: 10.29328/journal.jccm.1001004; 2:
-
Congenital Quadricuspid Aortic Valve, a Rare Cause of Aortic Insufficiency in Adults: Case ReportCyrus Kocherla*,Kalgi Modi. Congenital Quadricuspid Aortic Valve, a Rare Cause of Aortic Insufficiency in Adults: Case Report. . 2017 doi: 10.29328/journal.jccm.1001005; 2: 003-007
-
Short and Medium-Term Evaluation of Patients in Coronary Post-Angioplasty: Préliminary results at the Cardiology Department of the Hospital University Aristide Le Dantec of Dakar (Senegal): Study on 38 CasesDioum M*,Aw F,Masmoudi K,Gaye ND,Sarr SA,Ndao SCT, Mingou J,Ngaidé AA,Diack B,Bodian M,Ndiaye MB,Diao M,Ba SA. Short and Medium-Term Evaluation of Patients in Coronary Post-Angioplasty: Préliminary results at the Cardiology Department of the Hospital University Aristide Le Dantec of Dakar (Senegal): Study on 38 Cases. . 2017 doi: 10.29328/journal.jccm.1001006; 2: 008-012
-
Indications and Results of Coronarography in Senegalese Diabetic Patients: About 45 CasesNdao SCT*,Gaye ND,Dioum M,Ngaide AA,Mingou JS,Ndiaye MB, Diao M,Ba SA. Indications and Results of Coronarography in Senegalese Diabetic Patients: About 45 Cases. . 2017 doi: 10.29328/journal.jccm.1001007; 2: 013-019
-
Procedure utilization, latency and mortality: Weekend versus Weekday admission for Myocardial InfarctionNader Makki,David M Kline,Arun Kanmanthareddy,Hansie Mathelier,Satya Shreenivas,Scott M Lilly*. Procedure utilization, latency and mortality: Weekend versus Weekday admission for Myocardial Infarction. . 2017 doi: 10.29328/journal.jccm.1001008; 2: 020-025
-
Spontaneous rupture of a giant Coronary Artery Aneurysm after acute Myocardial InfarctionOğuzhan Çelik,Mucahit Yetim,Tolga Doğan,Lütfü Bekar,Macit Kalçık*,Yusuf Karavelioğlu. Spontaneous rupture of a giant Coronary Artery Aneurysm after acute Myocardial Infarction. . 2017 doi: 10.29328/journal.jccm.1001009; 2: 026-028
-
Thrombolysis, the only Optimally Rapid Reperfusion TreatmentVictor Gurewich*. Thrombolysis, the only Optimally Rapid Reperfusion Treatment. . 2017 doi: 10.29328/journal.jccm.1001010; 2: 029-034
Recently Viewed
-
Jaw Subluxation as a Complication of Tardive DyskinesiaDiana Paleacu Kertesz*. Jaw Subluxation as a Complication of Tardive Dyskinesia. Arch Case Rep. 2024: doi: 10.29328/journal.acr.1001112; 8: 131-133
-
Postpartum as the best time for physical recovery and health careShizuka Torashima*,Mina Samukawa,Kazumi Tsujino,Yumi Sawada. Postpartum as the best time for physical recovery and health care. J Nov Physiother Rehabil. 2023: doi: 10.29328/journal.jnpr.1001049; 7: 001-007
-
Effectiveness of massage chair and classic massage in recovery from physical exertion: a pilot studyIvi Vaher,Anna-Liisa Tamm*,Marit Salus,Kirkke Reisberg,Aleksandra Vähi,Helena Pallon,Andra Paeste,Bäthel-Betty Pirk,Margus Merila,Thomas Schrader. Effectiveness of massage chair and classic massage in recovery from physical exertion: a pilot study. J Nov Physiother Rehabil. 2023: doi: 10.29328/journal.jnpr.1001050; 7: 008-015
-
Remote Effect of Fascial Manipulation on Knee Pain: A Case ReportAsifuzzaman Shahriyar Ahmed*, Deepak Kumar Pradhan. Remote Effect of Fascial Manipulation on Knee Pain: A Case Report. J Nov Physiother Rehabil. 2024: doi: 10.29328/journal.jnpr.1001059; 8: 017-021
-
Management of Non-contact Injuries, Nonspecific Chronic Pain, and Prevention via Sensory Conflicts Detection: Vertical Heterophoria as a Landmark IndicatorEric Matheron*. Management of Non-contact Injuries, Nonspecific Chronic Pain, and Prevention via Sensory Conflicts Detection: Vertical Heterophoria as a Landmark Indicator. J Nov Physiother Rehabil. 2024: doi: 10.29328/journal.jnpr.1001057; 8: 005-013
Most Viewed
-
Evaluation of Biostimulants Based on Recovered Protein Hydrolysates from Animal By-products as Plant Growth EnhancersH Pérez-Aguilar*, M Lacruz-Asaro, F Arán-Ais. Evaluation of Biostimulants Based on Recovered Protein Hydrolysates from Animal By-products as Plant Growth Enhancers. J Plant Sci Phytopathol. 2023 doi: 10.29328/journal.jpsp.1001104; 7: 042-047
-
Feasibility study of magnetic sensing for detecting single-neuron action potentialsDenis Tonini,Kai Wu,Renata Saha,Jian-Ping Wang*. Feasibility study of magnetic sensing for detecting single-neuron action potentials. Ann Biomed Sci Eng. 2022 doi: 10.29328/journal.abse.1001018; 6: 019-029
-
Sinonasal Myxoma Extending into the Orbit in a 4-Year Old: A Case PresentationJulian A Purrinos*, Ramzi Younis. Sinonasal Myxoma Extending into the Orbit in a 4-Year Old: A Case Presentation. Arch Case Rep. 2024 doi: 10.29328/journal.acr.1001099; 8: 075-077
-
Pediatric Dysgerminoma: Unveiling a Rare Ovarian TumorFaten Limaiem*, Khalil Saffar, Ahmed Halouani. Pediatric Dysgerminoma: Unveiling a Rare Ovarian Tumor. Arch Case Rep. 2024 doi: 10.29328/journal.acr.1001087; 8: 010-013
-
Physical activity can change the physiological and psychological circumstances during COVID-19 pandemic: A narrative reviewKhashayar Maroufi*. Physical activity can change the physiological and psychological circumstances during COVID-19 pandemic: A narrative review. J Sports Med Ther. 2021 doi: 10.29328/journal.jsmt.1001051; 6: 001-007

HSPI: We're glad you're here. Please click "create a new Query" if you are a new visitor to our website and need further information from us.
If you are already a member of our network and need to keep track of any developments regarding a question you have already submitted, click "take me to my Query."


